

Not financial advice; DYODD. Please read the disclaimer before proceeding.
Pitch By Association
A cash-rich balance sheet the market prices as if it’ll be set on fire. A controlling owner nobody trusts. The valuation gap stays wide for as long as that trust doesn’t return.
I’ve seen this before. For a long while, CRON 0.00%↑ traded at $2.5/share with $2.2/share of cash, pricing the business at $0.3/share, ~1x revenue, a fraction of replacement cost. I flagged it in Dec’25. Few cared. It is $3.5 today.
Same story. Different sector. Cronos took time, then the trust started returning. This one hasn’t gotten there yet.
If you missed $CRON, here is a similar setup but before the trust returns.
Thesis Highlights
“~1x LTM EV/EBIT for a profitable business with a long operating history.”
Such a bull case, without exception, carries caveats. Four of them, specifically: high customer concentration, a CEO with controlling ownership, a governance exemption, and an M&A ambition with zero track record.
The conservative bull case suggests an 85-90% upside to fair value, avoiding optimistic assumptions and accounting for extreme bear scenarios. With some macro tailwinds, a multibagger is within reach.
Building a bull case is easy. Dispelling a bear one isn’t. This piece spends most time on the latter, taking four concerns seriously, one at a time.
Introduction
That enters OMS Energy Technologies, Inc OMSE 0.00%↑
OMSE makes specialty connectors, wellheads, and pipes for oil & gas wells, and services that equipment once wells are producing. Two-thirds equipment; one-third services. 11 facilities, 6 countries, ~600 employees.
The Setup
$4.5/share, 42.5Mn shares, ~$190Mn market cap. Net cash: $154Mn.
Stripping out cash, the market values the operating business, which generated $35Mn in FY26 operating profit, at ~$36Mn, ~1x LTM EV/EBIT.
Gross margin: 28-34%, operating margin: 20-30% for three years since 2024. Zero debt. Positive OCF every year, and net cash has more than doubled since its May ’25 IPO
OMSE isn’t a melting ice cube, but trades at 1x EV/EBIT. Innovex International (INVX), a close peer formed via the 2024 merger of Drill-Quip and Innovex, trades at ~17x LTM EV/EBIT. Hunting PLC, a smaller but more premium product comp, trades near 22x.
That gap is the bull case in one sentence. The rest is about whether the four concerns justify it.
The Origin Story
Founded in 1972 in Singapore. Owned by Scomi Group (Malaysia) until 2010, when Sumitomo bought it for ~RM320Mn (~$100Mn+). Sumitomo held it till 2023, when it was sold for $2Mn in a Management Buyout (MBO) to its own CEO, How Meng Hock, as part of a company-wide divestment program. OMS was too small to merit a mention in Sumitomo's (a giant trading house with $70Bn in assets) disclosures.
The deal produced a $49Mn bargain-purchase gain, as noted in the company’s IPO filing:
The price was fixed in 2022 during the COVID-era oil downturn, but the deal didn’t close until mid-2023, by which point asset values (esp. $33.4Mn of PP&E) had recovered.
CEO’s 100% ownership acquired in 2023 MBO diluted to 90% (Apr'24 recap), to 67.7% (Sep'24, $5Mn convertible notes and some pre-MBO equity holder interests at a ~$100Mn valuation), to 61.8% (May'25 IPO, 3.7Mn shares at $9, ~$380Mn valuation). That 61.8% is bear concern #2, and we'll come back to it. It is worth noting that the CEO never sold a single share from MBO to IPO.
Bear Concern #1: Customer Concentration
OMS discloses segment revenue and consolidated operating profit. Cross it with the geographic breakdown, and the concentration becomes much more specific than "one big customer."
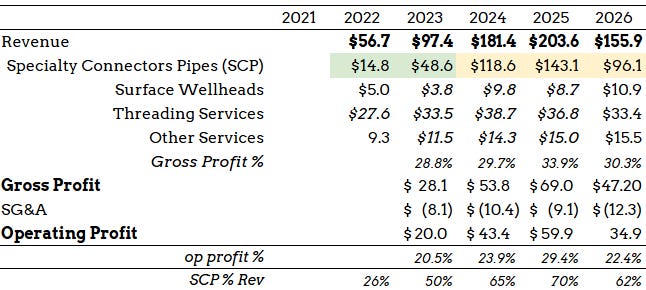
Revenue grew rapidly, from $56Mn in 2022 to $203Mn in 2025, then fell ~25% to $156Mn in ‘26. Segment-level results show the swing, both the growth and decline, is entirely in the SCP segment (Specialty Connectors Pipes).
Overlaying the geography sharpens the picture. Saudi Arabia accounts for 95%+ of SCP segment revenue, and Saudi is essentially Aramco. The crazy growth and brutal decline both come down to one customer: Aramco.

Saudi’s 28% margin is therefore a clean proxy for the SCP segment (as Saudi accounts for 95% of SCP). Thailand is threading-service-dominated; its 15.6% margin proxies threading. The remaining two segments, Surface Wellheads and Other Services, run a combined 10-11% margin, as shown in the table below, which provides revenue and profit for each region since 2024.
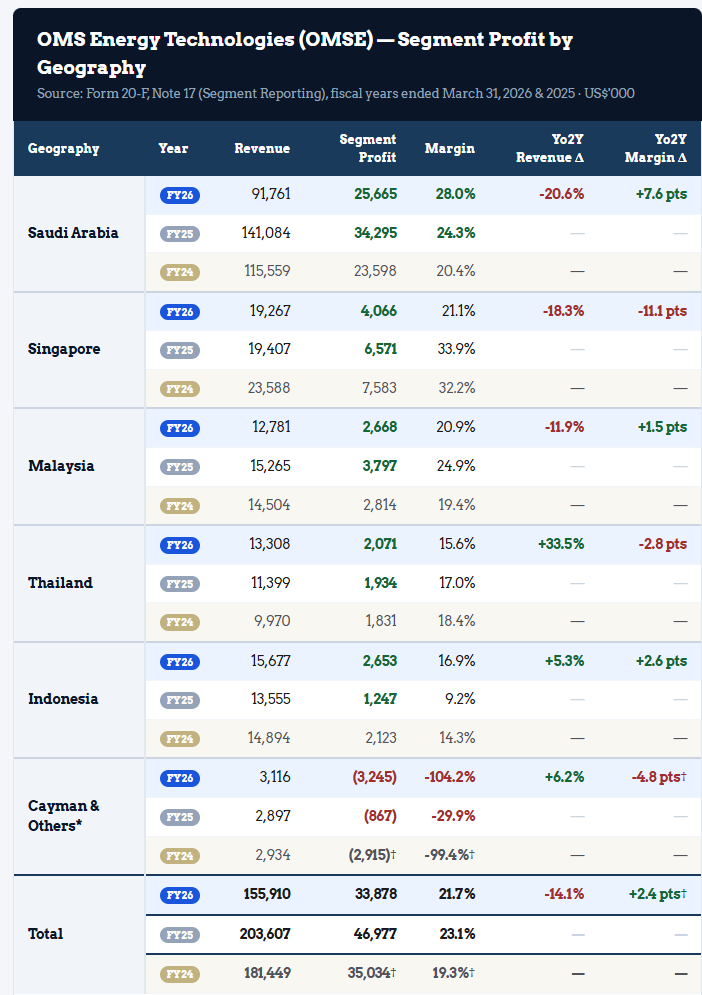
SCP makes up 62% of revenue and ~77% of profit. It is the core business, and Aramco is 95%+ of SCP.
Strip out Saudi (Aramco), and the remaining revenue has been flat in a $ 62- 66Mn range for three years, with operating margin running at 13- 20%. Thailand (+33.5% Yo2Y) and Indonesia (+5.3%) offset by Malaysia and Singapore decline as Petronas moved capex outside Malaysia, and softer Singapore demand.
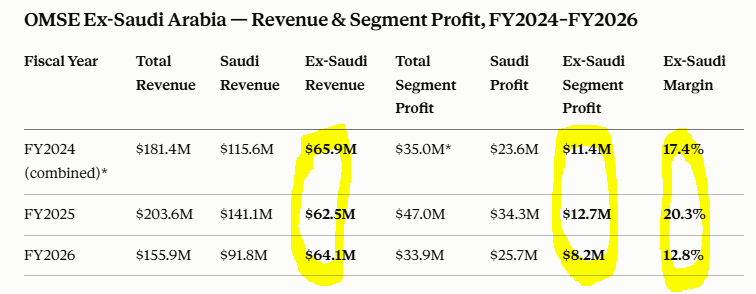
The number that actually matters: Aramco went from 67% of revenue in FY25 to 57% in FY26, accounting for almost all of OMS's revenue decline. A client responsible for 3/4 of total profit just cut its orders by ~35% in one year. That’s most of the story behind OMS’ ~50% stock decline since IPO.
But 2026 wasn’t a normal year. The Iran-US conflict (Feb 2026 onward) shut down ~95% of Hormuz tanker traffic, drone-struck Aramco’s largest refinery (Ras Tanura, March), and triggered “the biggest energy supply shock ever,” per Aramco’s own CEO.
Aramco spent the year in crisis-logistics mode, not routine capex. That context shall be considered to assess OMS’ CEO (HMH in Jun’26) commentary:
“These are deferred orders, not lost orders. Our long-term agreement with Aramco remains fully intact. Our relationship remains strong, and there has been no cancellation.”
In summary, Aramco concentration is real and worth watching closely. The recent revenue decline traces to the Iran-US conflict, not a lost relationship. Meanwhile, diversification effort is underway:
Halliburton — 2nd-largest client (10% of revenue). MPA signed Feb’23 (Malaysia), extended to Singapore by Sep’23. Private counterparty to formal multi-country agreement in under a year, versus Aramco’s 15-year arc. It shows diversification doesn’t have to be slow.
PTTEP — renewed 3-year agreement, 13 offshore rigs. State-linked NOC, but Thailand’s threading relationship still drove +33.5% Yo2Y growth, independently corroborated by Thai government data.
Kuwait, Oman, Indonesia — qualified/final-stage tendering.
Nigeria, Kazakhstan — early bids. All pre-revenue.
Before continuing to bear concerns #2 through #4, a quick detour into valuation, since we've just laid out the financials behind concern #1.
Valuation
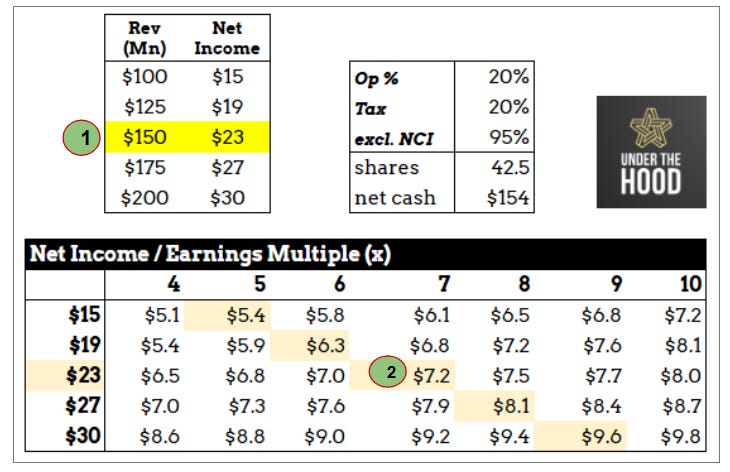
Assuming NTM $150Mn revenue (vs. FY26’s $156Mn), 20% operating margin, 20% tax, and shareholders’ 95% economic interest (excl. 5% NCI) gets to $23Mn net income.
7x P/E gets to $7.2/share (vs. INVX’s ~17x, and Hunting’s ~22x).
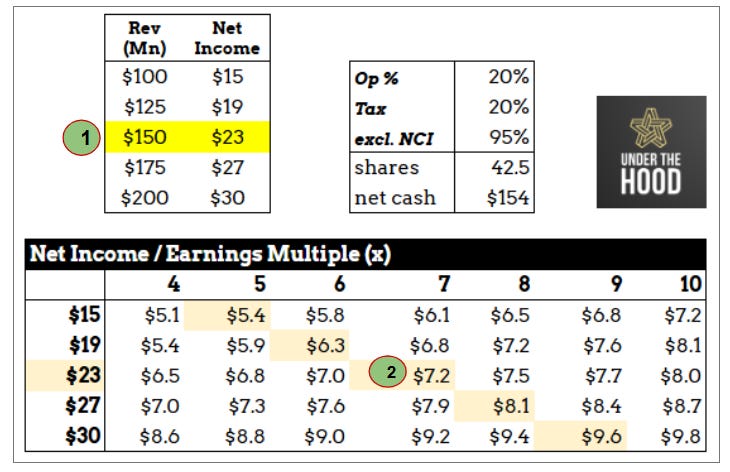
Note: 20% modeled operating margin is grounded in 2H26 ER mgt commentary:
“this year’s reported margin was elevated by mix... we would encourage modeling a normalized level modestly below [22.4%].”
The full matrix ranges from $5.1 to $9.8/share, with net income input $15-30Mn, multiple 4x-10x. Both ranges are conservative: INVX, its closest peer, currently trades at 17x LTM EV/EBIT, and over 30x LTM P/E.
Some will push back; this conservatism doesn’t offset the extreme risk of Aramco concentration. Fair, let us stress-test with a Sum-of-the-Parts (SOTP).