

Hunt for the "Lost" Profit in Amazon Empire
Hunt for the "Lost" Profit in Amazon Empire
and its strategy to unleash its earning power

Summary
Amazon AMZN 0.00%↑ carries paradoxes.
Amazon is known to be highly disciplined and operate efficiently at scale, yet its primary e-commerce business appears to struggle at profitability, only AWS comes to the rescue.
“AWS alone is worth the entire Amazon market cap!” is a commonly cited thesis among angry bulls who are frustrated with its often mediocre e-commerce results.
In this research, I explain why Amazon is often misunderstood. I use a “peer model” to examine the company under the hood, present the gap between its Reported Earnings vs “should-be” earnings, and further dive into each vertical business unit to rationalize my model.
I provide my estimates on where the “missing” profit might go, and more importantly, discuss Amazon’s strategy to unleash its true earning power.
The Most Misunderstood Mega-Tech
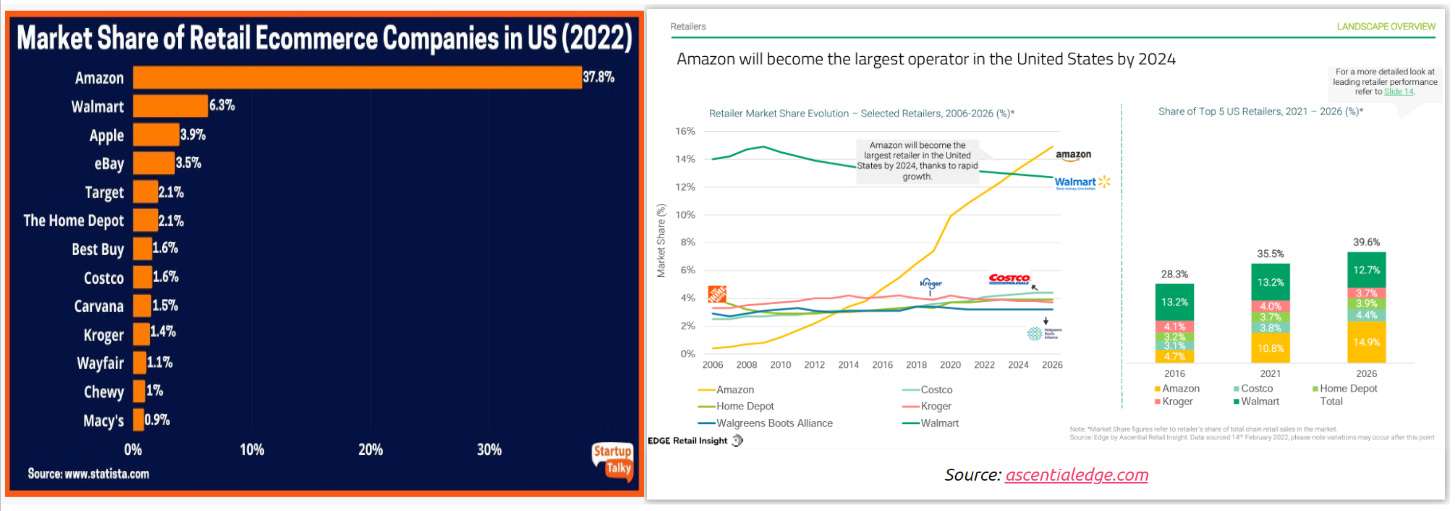
Amazon needs no intro - the largest retail e-commerce in the US with ~38% market share (larger than the next 9 combined), also the 2nd largest commerce operator in the US, slightly behind Walmart, and is slated to become No.1 by 2024.
Yet Amazon is often misunderstood, not only due to its unparalleled scale and its complexity but also because it is “primed” to be misunderstood.
I start with its segment-level income statement. 3 segments, revenue, expense, and operating income. Pretty standard stuff, why this is “primed” to be misunderstood?
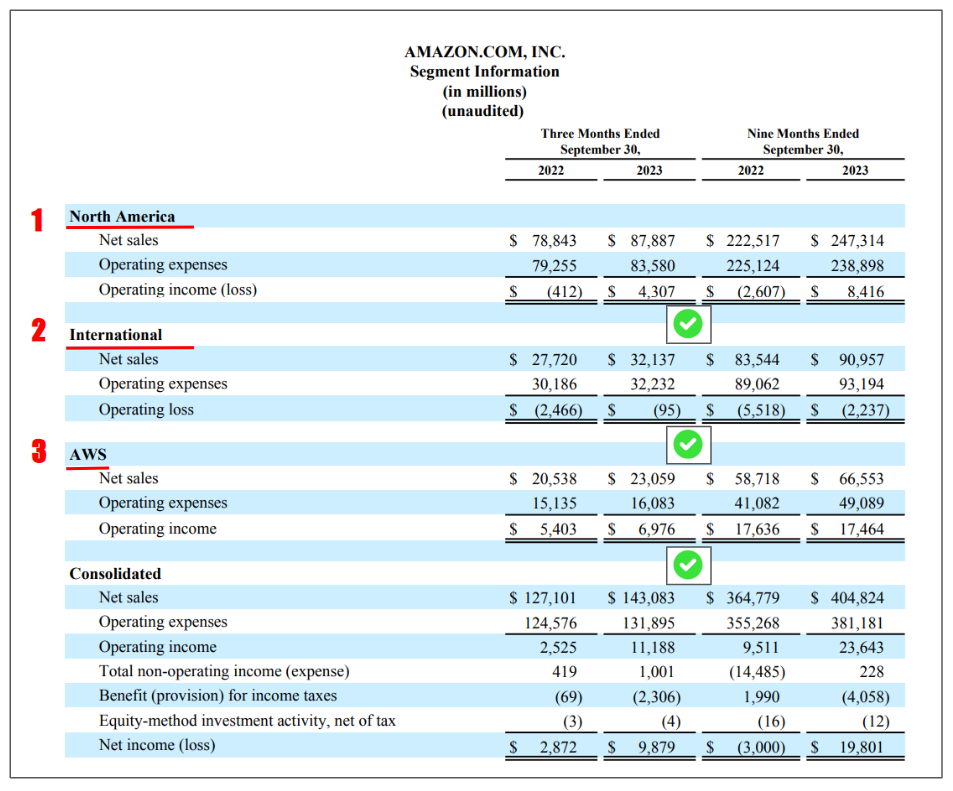
Take North America segment as an example. It blends its 1P business (think of Walmart or Target), and 3P business (think of eBay), which have different revenue recognition as 1P counts GMV as revenue, and 3P counts service fee as revenue. It further obfuscates unit economics by jamming high-margin advertising and subscription revenue in the segment. Not to mention tugging in money-losing businesses such as Alexa (~$10Bn loss in 2022).
I can keep going, but you get the big picture. Segment number provides a high-level directional indicator, but obfuscates the true earning power of each business unit.
So what’s the under-the-hood truth?
Three Big Ideas
Let us take a step back, and start with a Jeff Bezos quote.
We’ve had three big ideas: Put the customer first. Invent. Be patient. They are the reasons we’re successful
Throughout my research, I was impressed by how consistently these 3 big ideas were present, and I would like to highlight “Be Patient” first.
“Be Patient” means Amazon takes a long view and makes large investments eyeing for the future, often at the cost of immediate gratification (profit).
That is uncommon in today’s environment where the market judges co. by quarterly results. More importantly, that also means from time to time, The market punishes Amazon for doing the right thing. It happened before, I bet it will happen again.
That makes this research more worthwhile, so we are prepared to identify true signals from noises.
Amazon Strategy
1P business is how Amazon started Day 1: Amazon acquires products from vendors (for both private or named brands), and sells directly to consumers, a.k.a “Sold By Amazon” from consumers’ PoV.
Its scale can be appreciated by numbers, 300Mn+ customers (including 200Mn+ Prime), 5000+ vendors, $200Bn+ revenue, and an indisputable leader in the space.
Amazon’s massive 1P business offers merchandise at a compelling value to consumers. It competes at any cost to grab the market share and is able/ready to sacrifice profitability to remain dominant. It then leverages its large-scale infrastructure (built via 1P) to offer Value Added Business (VAB) at a lofty profit margin. In a way, Amazon’s 1P business is Amazon’s incubator engine.
That one-two-punch strategy is what I call Amazon's advantage.
Below shows how Amazon leverages its infrastructure to hatch new business at a massive scale:
Amazon’s 3P marketplace business ($350Bn GMV in Y22) leverages its fulfillment/logistic power
Amazon’s AWS business (~$90Bn Rev in Y22) leverages its computing power
Amazon’s Advertising business (~$35Bn Rev in Y22) leverages its massive Prime member eyeball value.
That all makes sense. A suspicious bear might ask with such large-scale VAB (3 of them!), shall Amazon run like an ATM machine i.e. printing money?
Where is the “Lost” Profit?
When a highly efficient and disciplined organization with a superior business model reaches a certain scale, it often enjoys steady profitability, such as Microsoft, Google, Meta, etc.
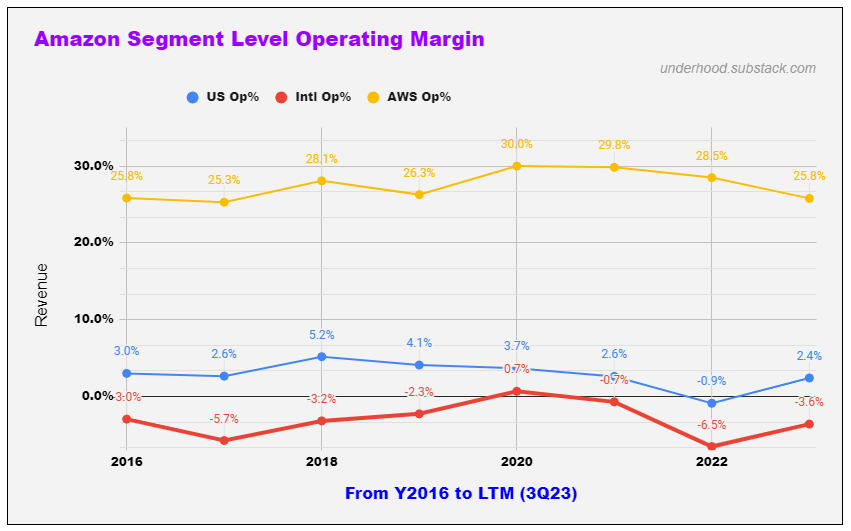
Not so much for Amazon. As the chart below shows, while its AWS segment maintains a healthy profit margin, its US segment struggles with a thin and unsteady profit margin (e.g. its operating margin dropped nearly 500bps from 4.1% in 2019 to -0.9% in 2022, despite its revenue increased from $170Bn to $316Bn), and its international segment remains unprofitable.
Over the last 12 months, Amazon sold ~$370Bn goods in its 1P and 3P marketplace in the US, and it had ~$40Bn subs revenue and $44Bn ads revenue. All of that generated a mere $8Bn profit.
Amazon doesn’t provide vertical business performance breakdown (e.g. 1P, 3P, ads, etc). Therefore I took a “Peer Model” approach to assess its performance from a different angle.
For each of its primary revenue-generating businesses, I chose its closest peer(s) and used their reported profit margin as a benchmark. To simplify the model, my focus is its North American segment in the last 12 months.
I chose Walmart (1P), eBay (3P marketplace), and Google/Meta (advertising) as Amazon’s corresponding business peers.

For those interested in the details, a few assumptions I used:
For ads revenue and Fulfillment expense, I use the US/Global GMV ratio to calculate their US revenue/expense portions.
For subscription, I take the US/global prime members ratio (and taking into account Prime unit price difference) to calculate its US revenue portion.
I deducted $16.5Bn content spending and $10Bn Alexa business loss from Prime Subscription revenue, as both spending enhanced its Prime offering.
I model Amazon’s 1P normalized profit margin 4% (Walmart ~3%, and Target ~5-6%, more details in a late section)
I model Amazon’s 3P marketplace margin at 20% (eBay ~20%)
I model advertising business margin at 45% (more details in a late section)
Its LTM total modeled “should-be” profit is $22Bn, $13Bn more than its $8Bn reported profit. It is worth noting that the model takes its massive fulfillment cost ($57Bn for the US) into full consideration.
There are 2 primary sources to hunt for the missing profit, unaccounted spending on other bets (e.g. Amazon Health), and/or a lower profit margin compared to its peers either due to operation inefficiency or Amazon giving extra benefits back to consumers.
On spending on other bets, the majority are already considered in media ($16Bn) and Devices ($10Bn, which also includes Project Kuiper, Kindle, and all Alexa devices). The only large initiatives I’m aware of that potentially moves Amazon’s needle (e.g. $Billion scale) is Health and AI/Anthropic (please comment if you know something else).
On 1P profitability, It is very possible that Amazon might have cut prices more aggressively (e.g. as opposed to a 4% profit margin) relative to its market position to enhance its Prime membership value proposition. Note its 1P US GMV is at 150Bn scale, so each 100bps price cut has a $1.5Bn bottom line impact.
On 3P and ads profit margin, on a comparable basis, I don’t think Amazon is less efficient than its high-caliber peers (more details in a late section).
So in summary, some unaccounted “betting the future” investments ($3-5Bn), and additional $ benefits to consumers($6-9Bn). They are slightly short of $13Bn missing profit.
An important disclaim: the above math is purely my guestimate, based on various data points I collected, and my confidence is not high in its accuracy at the line item level.
However, I’m fairly confident about what this points to at a big-picture level. I believe its 1P competes price fiercely, to the point that is barely profitable by itself. Its VABs (Value Added Business) are hugely profitable and can absorb its large infrastructure spending (e.g. fulfillment).
Ok, one might say, let us assume you are right. But what does Amazon do (going to do) to unleash its true earning power?
Unlease Earning Power
My answer might disappoint some - there is no magic wand, and Amazon will continue to execute its long-held strategy (Remember be patient?). Having said that, I think some of its strategies that I highlight below are underappreciated and, arguably under-followed, especially in its earnings release.
Shift from 1P to 3P: For both private brands (e.g. Amazon Basics) or named brands, Amazon acquires products from vendors and sells directly to consumers, a.k.a “Sold By Amazon” from end consumer PoV. Below is an example:

In Amazon’s early days, a majority (95%+) of products sold were 1P. Its first rapid shift from 1P to 3P was from 2001 to 2004, 3P grew from <5% to nearly 30%.
1P is where Amazon offers daily consumables/essentials at a reliable quality and competitive price. 1P is how Amazon converts its customers to loyal customers and gains e-commerce market share.
Walmart has about a 3-4% operating margin, Target is about 200bps higher. Many price comparison services suggest that Amazon, Walmart, and Target have overall comparable prices, while Target is slightly on the higher end, Walmart on the lower end, and Amazon in between.
Also worth noting is that Walmart breaks out its e-commerce results: its 2022 operating margin is ~3% ($4.3Bn/142Bn).
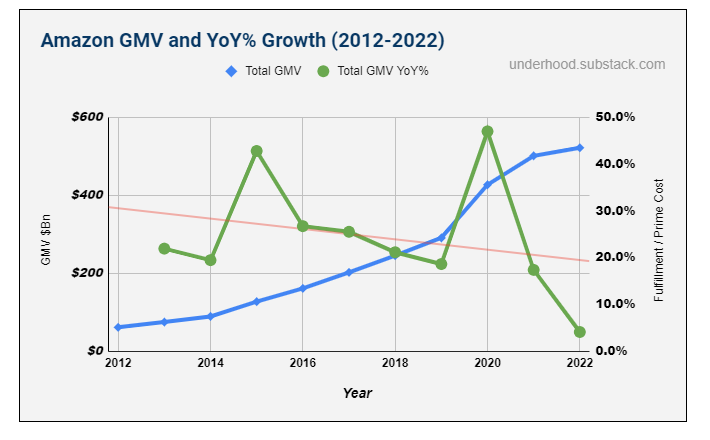
1P to 3P shifts can be best demonstrated via the chart below.
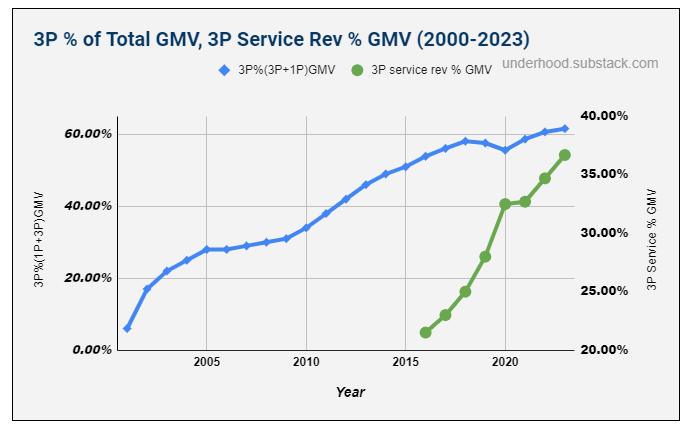
1P to 3P shift reflects a strategy shift from market penetration (a broad selection of essential consumables at low prices in 1P) to profitable growth (high-margin discretionary spending items in 3P).
This chart underscores Amazon’s continuous focus and long-term commitment to patiently move towards its goal. In almost 2 decades, it slowly builds its 3P business from nothing to over 60% total GMV.
What’s equally impressive is its reported 3P revenue as a percentage of GMV(*), showing on the right axis, has rapidly grown from slightly over 20% in 2016 to ~38% in 2022, demonstrating its irreplaceable values offered to its marketplace participants.
(*) multiple factors contribute to the rapid rise, including FBA and Amazon referral fee increases, and the percentage of 3P merchandise processed via FBA increase. Please refer to the Data Reference section for details.
In addition to both 3P service revenue as % of 3P GMV and 3P GMV as a % of total GMV moving favorably, Amazon’s total GMV, while experiencing slower YoY growth, continues to ride the e-commerce secular tailwind.
All in all a perfect setup for 3P business, with multiple levers all pointing in the same direction.
Firing on all Advertising Cylinders:
Amazon’s advertising business, built upon its exclusive access to its 200Mn+ prime customers, is THE fastest growing business - grew from $1.6Bn revenue in 2013 to $38.6Bn in 2022, an astonishing 42% CAGR in 10 years.
Here is my favorite chart to depict Amazon Ads business - it includes ad revenue from Google, Meta, and Amazon. It starts from the year when their ads revenue reached $1B (Y2003 for Google, Y2010 for Meta, and Y2013 for Amazon)
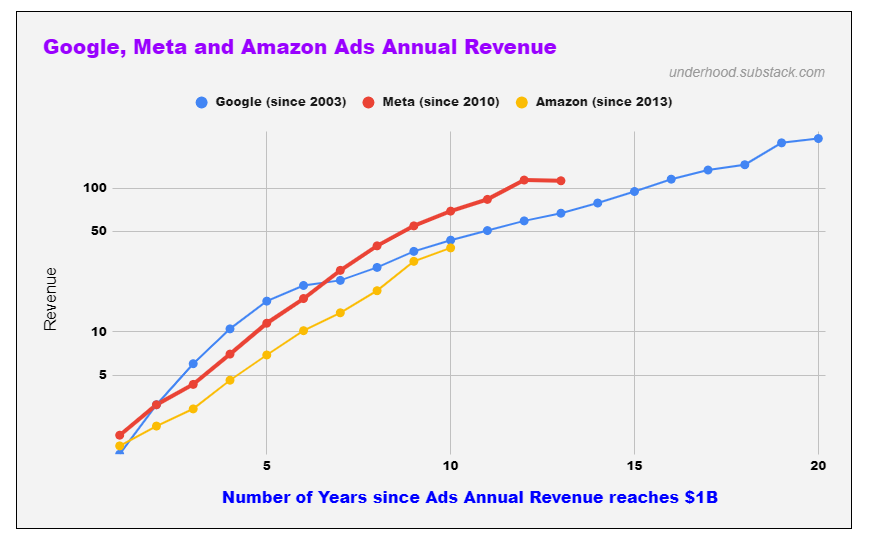
It is hard not to notice after reaching $1Bn in ads revenue, 3 giants’ revenues are on a similar growth trajectory for 10 years, and showing no sign of divergence today.
Google and Meta reached Amazon’s current ads revenue ($38Bn) in late 2011 and late 2017, with Enterprise Value $350Bn and $450Bn respectively at that time.
That’s about 10x P/S, and 20X P/EBT.
Despite tremendous topline growth, both Google and Meta advertising profit margins were stable at ~50% for quite a long time. (Meta’s 3Q23 registered 51%, with $17.5 Operating profit and $34Bn revenue).
Google ads Operating margin, at first glance, is a bit lower at 40%. (i.e. 3Q23, $59.6Bn revenue, $24Bn profit). But after extracting $12.6Bn TAC (Traffic Acqusition Cost), its profit margin is 51%.
Thus I model Amazon's advertising profit margin in a similar range, using 45% (err on the side of conservativeness) in my “peer model” discussed above.
An intriguing question is whether Amazon will follow Google and Meta’s footsteps on this growing trend. First, the last 10 Years’ results are a vote of confidence, but let us also take a look at Ads’ key growth drivers.
Total Amazon e-commerce volume
3P GMV as a percentage of Total GMV
ads revenue as a percentage of 3P GMV
That’s right, growth drivers are almost identical to 3P marketplace business as discussed above, all of them move favorably to the advertising business.
A Simple Valuation
I will keep it simple and a bit unconventional.
I value its 3 VABs (Value Added Business) at $1.3T, which includes:
Advertising: this $43Bn LTM rev, growing at ~25% YoY business, if we use Google and Meta’s past valuation at today’s Amazon ads size, it would be worth $400Bn to $450Bn (10x P/S). If Amazon follows Google and Meta’s footsteps (as the chart suggested), its revenue and profit would double in less than 4 years, and its $400Bn to $450Bn valuation would seem very mispriced at 10x 2027 P/EBT.
Taking that and the discount rate into consideration, I adjust its present value to $600Bn.
US 3P marketplace: 63Bn revenue, modeled $13Bn profit, 20x P/EBT values it at $260Bn.
AWS: LTM operating profit $23Bn, 20x P/EBT, ~$460Bn.
Amazon’s current enterprise value is $1.5T
So at today’s price, we pay $200Bn for its US 1P business, its Prime and associated programs, and its international 1P+3P segment. One might argue international might never reach profitability, and the US always battles in a highly competitive retail market, thus its marginal profitability might not be worth much.
I think differently. I think what we really get are:
A proven incubator engine (via its 1P biz and 200Mn+ prime members) that successfully, in 2 decades, hatched 3 large VABs (Value Added Business), collectively generating $60+Bn profit a year.
I honestly don’t know how to value it (as I don’t know when Amazon will hatch its 4th VAB), but I think $200Bn is a steal.
Its international segment upside potential. It hasn’t been profitable for so long, many already wrote them off, but they are marching towards breakeven, and if Amazon’s past is a reliable indicator of its future, my bet is it will turn profitable. And I like this bet a lot especially considering we’re not paying much for the bet.
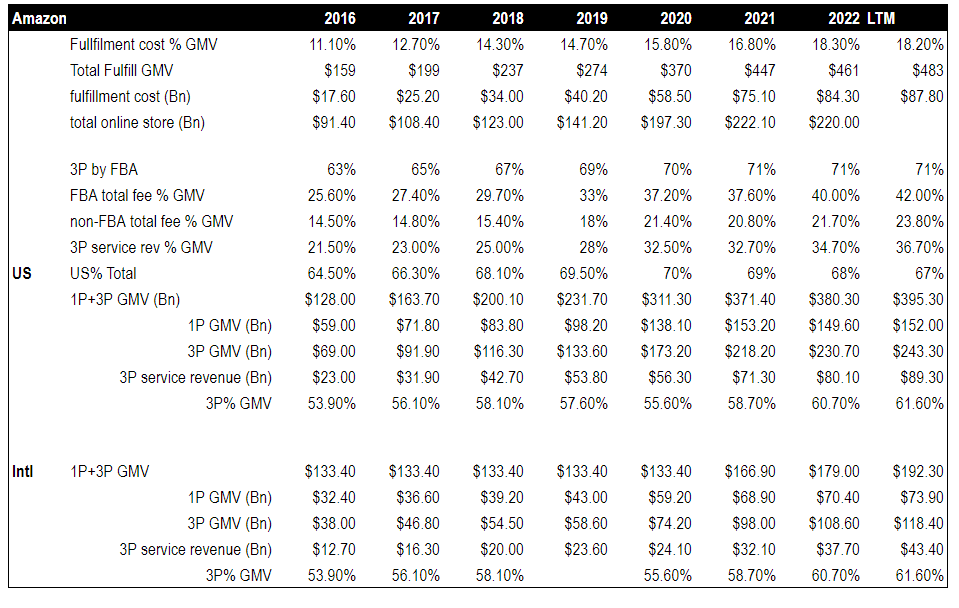
Data Reference
For readers familiar with Amazon’s reporting, as you go through my analysis you probably wonder how I get certain data (e.g. 3P service rev as % of 3P GMV) as Amazon doesn’t disclose many of them directly.
The table below provides some insights into how I go about modeling some of them. There is nothing fancy, but many moving pieces from various sources (e.g. shareholder letters, conference calls, industry reports).
If you find any of the data below doesn’t match what you know, please leave your comments so I can look into and correct them. I appreciate your feedback.
Food for Thoughts
I want to end this article with one of my favorite Bezos quotes:
If we work on a three-year time horizon, then you're competing against a lot of people. But if you're willing to invest on a seven-year term, you're now competing against a fraction of them, as few are willing to do that.
At Amazon, we like things to work in five to seven years. We're willing to plant seeds and let them grow and we're very stubborn.
If you are still with me, thank you and I appreciate it. My work is tailored towards curious-minded investors, who like to explore new ideas, dig deeper, and make their own decisions. My goal is to be a part of your research process, provide relevant info, and offer your insights/model to project what the future holds.
If that is of interest to you, please subscribe and share it with your friends.