
Finding Value in Dollar Store Dumpsters
who is the baby thrown out with bathwater?

Backdrop
This chart (since 1Q23) shows a sharp contrast between super-centers/off-price Stores and Dollar Stores, with formers up 50%+, latters down 50%+ (e.g. WMT 0.00%↑ (71%) TJX 0.00%↑ (52%) vs DLTR 0.00%↑ (-53%), FIVE 0.00%↑ (-49%) and DG 0.00%↑ (-66%))

It suggests Dollar Stores are losing to its competitors, as Walmart flexes its scale muscle on pricing and marketing, Amazon pushes rural delivery, and Temu expands relentlessly (from 0 to $20Bn run rate in <2Y).
Let us dive into that (perceived) dumpster fire.
Finding Summary
Dollar Stores face challenges today, but I think the market overreacted and threw the baby out with bathwater. Dollar Tree ( $DLTR ) is that baby.
I start with a banner comparison to orient you in the dollar/discount store landscape. Then I:
Show Dollar Tree's core business performed (surprisingly) comparably to Northstar (Walmart US) since 2023, despite DLTR being down 50% (vs. WMT up 70%).
Analyze dollar store sector's recent weaknesses (headwinds/competitive dynamics).
Zoom in on DLTR, its story, CEO & team, and ‘terrifying’ 2Q24 ER.
Use Sum-Of-All-Parts, DLTR EV valued at 9x Dollar Tree (DT)’s normalized EBIT, assuming 0 value to its Family Dollar (FDO). Low among peers, and to its past.
Unlocking SOAP value is not wishful thinking, with its recently announced FDO strategic review.
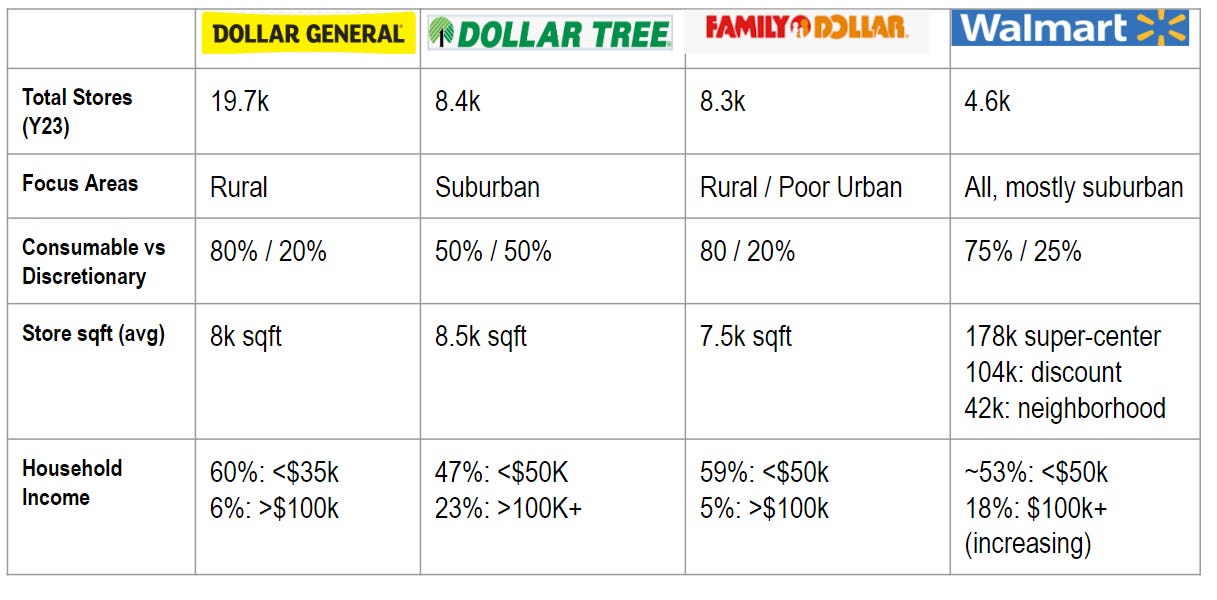
Head-to-Head Comparison
Retail banner abbreviations:
Family Dollar (FDO), Dollar Tree(DT) - both are DLTR business units
Dollar General(DG), Walmart US(WMT), Five Below(FIVE)
All dollar stores are small (7500-8500 sqft), v.s. WMT’s 5x-20x in size.
DG/FDO concentrates in rural areas, and DT/WMT in Suburban. FDO also has urban coverage, mostly in troubled neighborhoods.
Most DG/FDO consumers are in the low-income bucket (<$30k), while DT and WMT’s clientele have higher income exposure.
DG/FDO/WMT are 80% consumable and 20% Discretionary, while DT is split evenly.

3 Charts
The charts show Same Store Sales Comp (consumable/discretionary), and Operating Margins of 5 retail banners since Jan 2023.
On consumables, DT and WMT are tracked comparably, and so are FDO and DG. On Discretionary, DT and FIVE are tracked comparably, and so are FDO and DG. WMT is an outlier underperforming DT/FIVE in 2023, surpassing both since 1Q24.
On Op Margin, DT led the group (large decline since 1Q24), DG/WMT in the middle, and FDO struggled near breakeven.

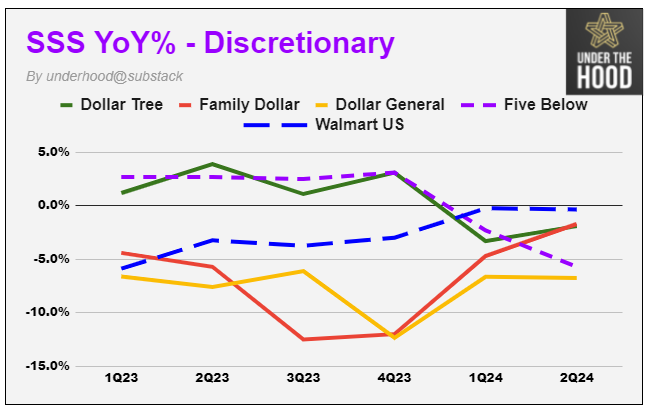

Note: Walmart’s General Merchandise is used for the discretionary calculation. Walmart and Dollar General SSS YoY% are estimated based on filing data as they don’t directly provide them.
Observe Data
DG and FDO have a similar clientele (lower-income), so are DT and WMT (higher-income)
FDO and DG’s fast SSS YoY decline in 2023 reflected the low-income households’ belt-tightening kicking in first. FIVE/DT maintained positive growth in 2023.
Mid- to high-income belt tightening kicked in early 2024. Discretionary sales in DT/FIVE dipped in 1Q and 2Q24. Both (1 and 2) were observed during challenging times (e.g. GFC).
WMT discretionary SSS YoY lagged DT/FIVE in Y23. It improved and remained flat in 1Q and 2Q24, while DT/FIVE SSS YoY declined. The divergence between WMT (improvement) vs DT and FIVE (decline) since early 2024 is worth noting.
FDO/DG had 6 quarters of SSS YoY decline, bottomed in 4Q23, and has been on a slow recovery path since, with consumables back to positive and discretionary still in the negative.
Analyze Data w/ Mgt Commentary
As expected, observations 1, 2, and 4 were previously observed in consumer belt-tightening behaviors during challenging times. They’re macro-related, non-company specific.
Observation 3 suggests Dollar Stores might lose a convenience vs value battle against Walmart & Co., a structural risk if that trend continues. I will dive deep into this.
First, WMT / DG executives commented (2Q24) on Walmart’s nice job of capturing new customers (trade-down from higher-income cohort) thanks to pricing and marketing investment. That would explain much of the revenue divergence between Walmart and DG/DLTR.
Walmart, 2Q24, Rainey (CFO)
Across categories, we're providing low prices and winning customer consideration, including in general merchandise
But we like what we're seeing in general merchandise, first time in 11 quarters that we've seen positive inflection there. … Not so much what's happening broadly in the economy, but specific to our business… we're expanding our assortment, more relevant to customers.
Dollar General, 2Q24, Vasos (CEO)
what we saw is the guys down in Bentonville * are doing a pretty nice job in garnering available traffic that's out there from other retailers.
* Bentonville, AR is walmart’s HQ.
2ndly, DLTR had a perfect storm in 2Q24. The headline reads DT's declining operating margin (8.4%, lowest in a decade v.s. 10.3% 2Q23), and declining net income ($132Mn v.s. $200Mn 2Q23).
Diving deep I find a few one-off items: a $65Mn hit on a one-time general liability adjustment (~100bps op% impact). Its lowered 2024 outlook also absorbs ~$25Mn upfront costs from acquiring/reopening the 99 cents-only stores, and additional labor costs for multi-price store rollout. That, in part, explains the 500bps operating margin decline from DT’s average (13.4% vs 8.4% in 2Q24).
Other Competitive Dynamics (Amazon / Temu)
Amazon’s rural delivery push1 announced in July 2024 will have more impact on Dollar General and Family Dollar than Dollar Tree, given its rural focus.
Temu: 80Mn US users, ~$10Bn Sales in 1H24, $20Bn Y24 run-rate (rumored target $30Bn). In the discount discretionary landscape, Walmart ~$120Bn, Dollar Tree (incl Family Dollar) ~$12Bn, ~Dollar General $10Bn a year. US Consumer discretionary spending is ~$1.5T/year.
Temu is ~2% of discretionary TAM, but a meaningful player in the discount landscape. It is still too early to assess its long-term impact, but shall not be ignored.
Next, let us zoom in on Dollar Tree.
Dollar Tree Story
Dollar Tree is the 2nd largest dollar store by sales (~$31Bn LTM).
It has 2 banners, a thriving Dollar Tree (~$17Bn LTM sales) and a struggling Family Dollar (~$14Bn LTM sales), with distinct differences (discussed in the above section).
Dollar Tree grew steadily (Rev 8% CAGR since 2012) with a lucrative 13%+/-2% operating margin. Family Dollar has been struggling since its acqusition and underperforms its closest peer Dollar General, mostly near breakeven.
Activist Mantle Ridge took a 6% equity (~10% with derivative) in 2021. Paul Pilal (Mantle Ridge founder) and Rick Dreiling (Dollar Store OG) joined the Board in early 2022. Dreiling became the CEO in early 2023, taking over Mike Witynski.
Rick Dreiling, with his hand-picked team, McNeely/Gatta in merchandising, Kindy in Supply Chain, and Mike Creedon (COO) as his deputy, wasted no time identifying and tackling challenges systemically as how he did in Dollar General (2008-2015). I recommend DLTR Investor Conference 2023 if you want more details.
Noted Dreiling was granted options (5Y) in Y22 to buy 2.25Mn shares at $157/share. A large amount (~1% total outstanding), 2.2x of its current price, and Dreiling participates in no other stock award program.
Valuation
DT and FDO, DLTR’s 2 banners are a tale of 2 cities. Below are the differences since Dollar Tree acquired Family Dollar in late 2015.
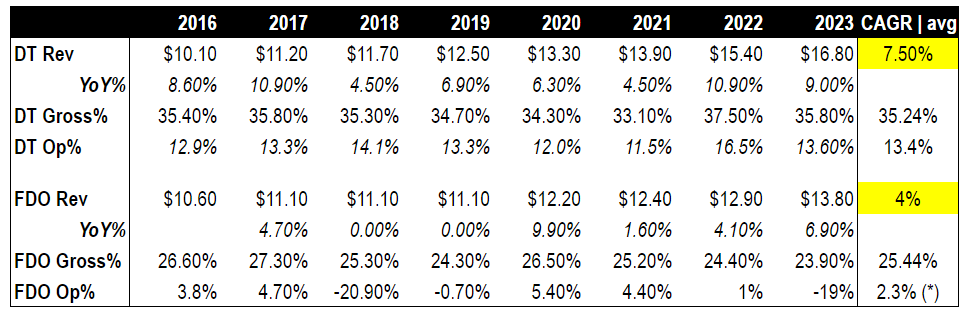
DT napkin math: $17Bn LTM Rev, ~13% avg op margin since 2016, 24% tax, $250Mn CorpEx (50% total LTM CorpEx), that is ~$2Bn normalized operating income (EBIT), $1.5Bn after tax, at DT banner level.
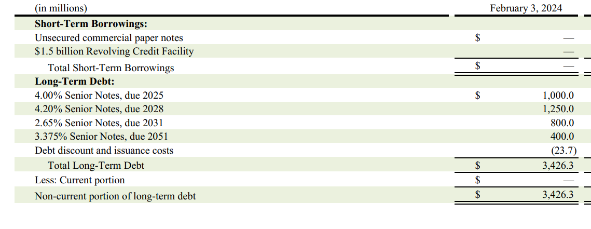
At $72/share, 215Mn shares, it is 15.5Bn Mkt Cap. With $2.8Bn net debt (3.4Bn debt, 0.6Bn cash), its EV is $18.3Bn.
Note its debt stack has 1.2Bn long duration, low-interest notes ($0.8Bn 2.65%, due Y31, and $0.4Bn, 3.375%, due Y51). They trade at 85c and 70c for a dollar, thus adjusted to $18n EV.
Assigning zero value to Family Dollar, the Dollar Tree banner is valued at 9x EV/normalized EBIT, a compelling valuation as:
DT is profitable (~13% Op Margin, +/-200bps) with a steady growth runway, 8% rev CAGR over the last decade.
FDO is a $15Bn run-rate biz if excluding twice goodwill impairment, an average ~2% op margin since the 2015 acqusition.
As a reference, Walmart trades at ~24x LTM, Target at ~14x LTM, Dollar General at ~10x normalized EV/EBIT.
But Sum-of-All-Parts?
Unlocking SOAP potential often looks attractive, but falls short in real life. So why do I use SOAP?
In June 2024, DLTR announced a review of strategic alternatives for Family Dollar. CEO Rick Dreiling said, in part:
The unique needs of each banner at this time – transformation at Family Dollar and growth acceleration at Dollar Tree – lead us to the decision to conduct a thorough review of strategic alternatives for the Family Dollar business. Our goal is to position Dollar Tree and Family Dollar banners to progress further and faster, and to determine whether the exclusive attention of a dedicated team will benefit both, while creating value for Dollar Tree shareholders and other stakeholders
It spelled a clear intent to run 2 units independently, likely through spin-off or sale, ofc no assurance it could materialize. I followed Dreiling for years and found him a man of his word. So my SOAP bet is a bet on Dreiling.
A conservative SOAP Valation (we assign 0 to FDO!) is already attractive, but there are more upsides.
Multi-price Rollout
Dollar Tree adopted a “break the buck” strategy in late 2021 to set most items to $1.25, after years of tryout and internal resistance.
A good portion of Dollar Tree’s revenue and margin improvement in 2023 was attributed to that, according to management.
But it doesn’t end there. Dollar Tree has been toying with a multi-price strategy (i.e. $1.5, $2, $3, $4, $5 price points, aka Dollar Tree+) since Y19, and stores with multi-price layouts reported increased ticket size, revenue, and higher margins.
Rollout was slow initially, roughly converted 1/3 of stores by 2022. It accelerated in 2023 (expanded to ~50%), and plans to roll out to all by early 2025. Currently, ~15% SKU is multi-price items, and the majority are consumables. Mgt plans to expand SKU%, focusing on discretionary items (higher margin). As CEO Dreiling said, “Once we broke the dollar, any backlash on that is behind us”.
“Breaking Price Point” is a tried-and-true strategy for dollar stores. Dollarama, Canada’s largest discount store, was a successful story executing the strategy in 2009. It increased transaction size, and store traffic, as multi-price expands assortment horizon and offers more value. Dollarama is a 20x since IPO in 2011.
Concluding Thoughts & What to Watch
As I dive into data, and recent mgt commentaries, I think Dollar Stores’ revenue weakness/margin pressure in recent months, a large part of it, is due to macro headwinds. I believe these macro headwinds expose no durable or structural risk to Dollar Stores.
That, together with DLTR’s attractive SOAP valuation, strategic reviews to unlock SOAP potential, and rockstar CEO (Dreiling) with his hand-picked team executing profit accretive strategies, presents an opportunity to own DLTR at its current price.
I will watch closely:
FDO strategic review progress
Competitive dynamics in future quarters, esp. WMT SSS YoY% (consumable and discretionary) and operating margin vs DG, DT, and FDO’s.
Temu’s growth trajectory
To learn more about Rick Dreiling, and his past work at Dollar General, I wrote here.
How much of a threat is WMT, Aldi and Temu to the dollar channel? Are delivery and pick-up options that they’ve rolled out stealing customers from dollar? Or are these services targeted towards existing WMT customers (meaning that WMT offers pickup isn’t a traffic draw from dollar to WMT as the dollar customer doesn’t care about delivery and pick up)
Did Rick institute practices that were ‘good’ for FD or did he try recreating the DG playbook at the FD banner? Which might not work as these banners service vastly different customers, with different assortments, and in different urbanities?